Onboarding best practices
Part 5: Onboarding metrics that inspire action
August 29, 2016 | By Leslie Deutsch

Measuring the success of your onboarding process is a lot like playing baseball.
Despite the August heat, my thoughts are turning to the playoffs. Statistics are a staple of baseball, and no matter which team is your favorite—or whether watching grown men wind up pitches for hours bores you—I’ll bet you can list at least a couple of the sport’s standard metrics.
Tracking those stats gives coaches actionable insights into what’s working, when they need to switch strategies or players, and how to optimize their results.
This metrics-based philosophy applies to onboarding, too.
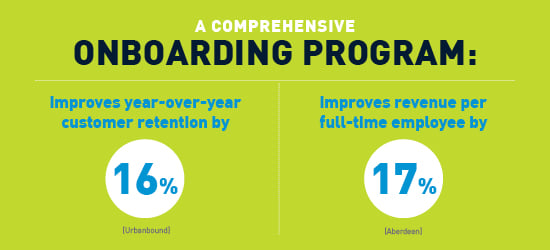
Several recent studies have confirmed a direct causal linkage between a strong, comprehensive onboarding program and superior results—16 percent improved customer retention and 17percent higher revenue per full-time employees, to name a couple.

Cover the bases
No matter what your organization’s onboarding level of maturity, these five metrics provide a solid baseline for gathering information before you implement anything new.
|
Onboarding Pillar |
Metric |
Why measure it? |
|
Recruiting |
Quality of candidates |
Shorter time to hire or cost per hire doesn’t necessarily indicate better fit or quality; look to the results of your screening process to weed out less-qualified candidates |
|
Pre-boarding |
100% Day 1 readiness: forms completed, work station in place, critical systems access, logistics |
Shows whether your checklists, handoffs and automation improvements work or require optimization |
|
Orientation |
New hire engagement |
Surveying new hires after orientation on their impressions of corporate culture, business strategy and whether they feel connected to colleagues has implications for retention and productivity |
|
Performance (role-based ramp up) |
Time to productivity: 30/60/90 day benchmarks |
Compare time to productivity for new hires who participated in the onboarding process vs. those who did not |
|
Onboarding process (overall) |
Retention: 6 months, 12 months, 3 years |
Compare results for new hires who participated in all/some/no onboarding processes to measure overall onboarding impact on turnover |
If you aren’t already capturing these metrics, start NOW. The No. 1 missed opportunity when implementing metrics is failing to measure the current state. Capturing the pre-transformation status allows you to show how your onboarding investment yields benefits, and also establishes realistic targets for incremental improvement as you make progress toward your goals.
These metrics are helpful for measuring organizational performance, but you may want to develop a few more to identify specifics. There are a few tips when considering what else is worth measuring.
Focus on a few meaningful onboarding metrics
By establishing a few key metrics in each onboarding pillar, you create important information for decision-making that will yield ongoing benefits, such as:
- Targeting onboarding dollars most effectively: Align content and programming where it’s most impactful to generate desired results (e.g., if Day 1 readiness is an issue for you, metrics help you find root cause issues and potential solutions)
- Providing clarity into process gaps: Hone in on areas requiring improvement (e.g., post-training surveys to measure content effectiveness)
- Directly linking onboarding program participation to business performance: For instance, determine if there are notably different outcomes if new hires meet regularly with peer mentors within their area vs. other business areas
Is your metric actionable?
Metrics, when used effectively, can drive change and align individual and organizational behavior to achieve goals. Not all metrics are useful, though, and I’ve met many business leaders who have realized their metrics were too expensive to monitor regularly, or even caused unforeseen negative results.
Automate metrics gathering
Chances are you don’t have the resources of a Major League Baseball coach. If it takes an army of people to gather and produce metrics reporting, you aren’t likely to bring it into ongoing operations. Look at how to use existing systems to generate useful onboarding data, even if it means investing in a few key enhancements. This will pay off in the long run as you can monitor trends, compare results across different areas of the organization, and elevate onboarding metrics to become a useful tool for decision-making.
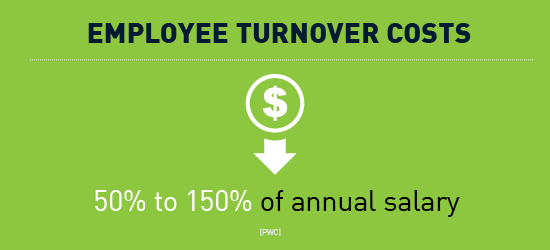
In the case of onboarding, remember the benefits aren’t limited to the new hires only—better retention and engagement save you the incremental costs of recruiting, hiring and additional onboarding for replacement hires.

As new hires bring their enthusiasm and high-performance mindset into the workforce, they reignite the passions of and inspire their teammates. The benefits of a great onboarding program are contagious and motivate existing employees as well as your new hires.
Evaluating your onboarding program is the final step in creating a best-in-class onboarding experience. I encourage you to read the rest of our onboarding best practices series, which covers designing your ideal program, pre-onboarding to engage new hires, orientation, and post-orientation onboarding activities.
Your talent can achieve peak performance
We can help.
