Healthcare demand forecasting, in sharper focus
May 22, 2018 | By Felix Christopher, Lokesh Pandit, Ashesh Parikh and Alisha Satish

Forecasting healthcare demand is a tricky problem for providers and payers, made more complicated by a patchwork of government insurance and healthcare delivery programs that complement private offerings. To say it make budgeting tricky would be a laughable understatement.
That’s why regression analysis is a potentially transformative tool for the healthcare industry. As more healthcare organizations turn to demand forecasting to predict potential device usage, patient demand and even whether to build new facilities, they’ll need powerful forecasting tools that keep up with the many complex variables at play. Healthcare’s efficient performance—and ability to compete—is at stake.
Regression analysis can help determine the strength of the relationship between one response variable and a series of other changing independent variables (or predictors). In other words, it’s well-suited for an increasingly complex industry where demand for medical services are likely to be dependent on several factors such as population, demography, region and so forth. Regression allows you to mathematically establish the relationship between predictors and response variables, leading to greater precision in forecasting.
Getting technical for a moment…if you’d like to learn more about general forms of regression types, you can visit Investopedia’s excellent resource page.
Bringing regression analysis to business audiences
Your business users are probably familiar with Tableau, a commonly used visualization tool. Even if they’re not, Tableau produces intuitive visualizations that help people understand complex data. R, on the other hand, provides high-powered statistical analysis and reporting—but it’s not user-friendly. R is an open source programming language for statistical analysis, graphics representation and reporting. However, the biggest advantage of R is its very vibrant community of developers and contributors that develop new packages and applications.
Tableau is widely distributed data visualization tool unique features, including an intuitive interface for visualizing and manipulating data. It offers an easy path for visualizing relevant data for the uninitiated. After analysis, sharing with others is as easy as publishing to Tableau Server.
Like any commercially available software, Tableau comes with its limited functions/libraries that are available for analysis. One way to circumvent this limitation is to import libraries available in R and deploy them in Tableau.
How to Integrate R with Tableau
- Install Rserve package in RStudio
You will need to install the Rserve package. To do this, click on Packages , thenInstall. Then, type in Rserve and it will find the package for you to install.
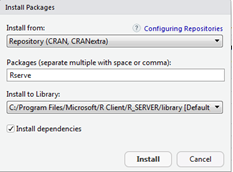
Figure 1: Install Rserve package in RStudio
- Set up Rserve connection
Now you will need to run the following code to start up the Rserve connection:
Library (Rserve)
Rserve()
- Set up the external connection in Tableau
Tableau needs to have the external connection set-up in order to run R. Go to the Help – Settings and Performance – Manage External Connections.
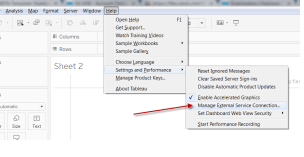
Figure 2: R connection in Tableau
- Start Using your R integration with Tableau
The integration uses calculated fields to pass R code. There are four different types of calculations used in the R integration:
- SCRIPT_BOOL
- SCRIPT_REAL
- SCRIPT_INT
- SCRIPT_STR
The basic set-up of any R calculated field is as follows:
SCRIPT_REAL (
“R code”,
Tableau fields being passed in
)
How we used regression analysis to enhance health insurance forecasting
In this project, we decided to forecast the number of people who would choose to be insured or not. So, the total number of insured people for three years (2013, 2014 and 2015) had to be forecasted to help an insurance provider manage its resources more efficiently.
Approach
First, we integrated Tableau with R, creating a Parameter field for the years of required forecast value, which appears as the Current Value field in the screenshot below:
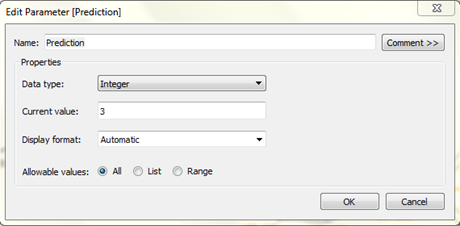
Figure 3: Tableau Parameter field
Step two: We created a Calculated field as shown in the screenshot. It contains R script coded as part of SCRIPT Real Function. Since this is a time series, we imported two R libraries, viz. forecast and lubridate. We obtained forecast values by calling R, and forecast values are appended with the original values.
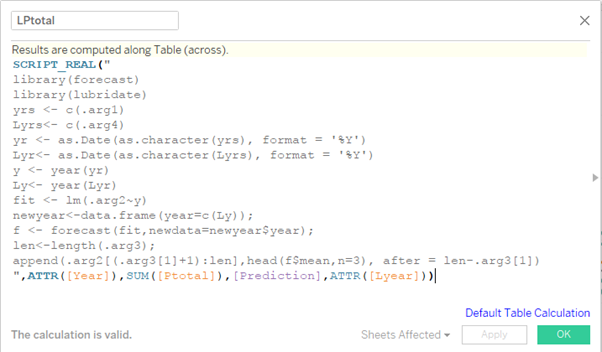
Figure 4: Tableau RScript
Health insurance coverage dataset
The U.S. Census Bureau has collected a lot of historical data of health coverage. We use the data that tabulates information of coverage for all persons (table HIB-2).
This table shows the number of people covered by government and private insurance, as well as the number of uninsured.
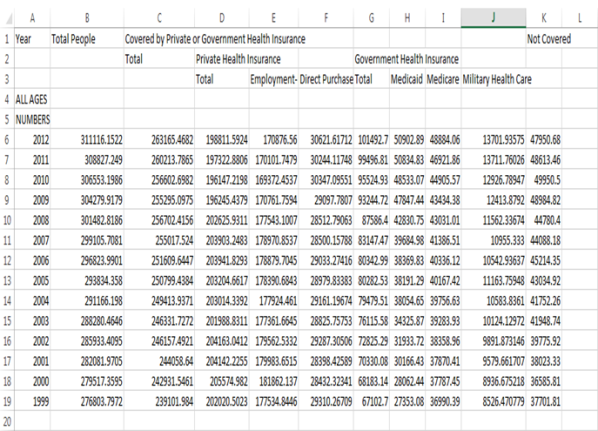
Figure 5: Health insurance data
Visualizations using Tableau
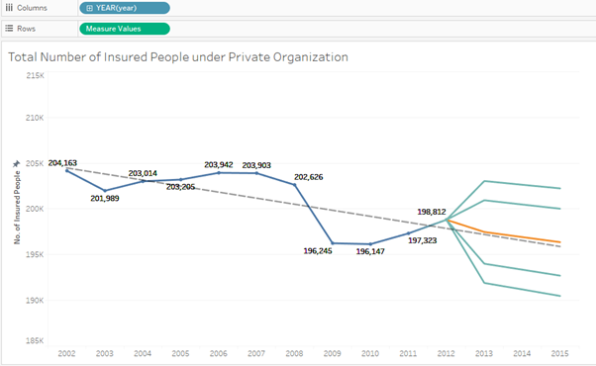
Figure 6: Tableau visualization
Orange: Forecasted value
1st and 4th blue lines: Display forecast with 95% confidence
2nd and 3rd blue lines: Display forecast with 80% confidence
Summary: What’s ahead
The potent combination of R and visualization tools like Tableau could be hugely impactful for healthcare in coming years: for payers, providers and even government agencies. This specific use case predicts or forecasts the number of people who are able to get insurance through private organizations. While the general population is increasing, the trend points to a population with declining coverage. This should be an important pointer to the government about a possible increase in population of uninsured. It also helps the government and payer organizations decide the amount of budget to assign for the upcoming year to cover people moving in and out of government healthcare programs—a boon for efficiency in spending.
Analytics in action
TEKsystems’ Data Analytics practice can help you unleash your data. We combine technical expertise with business acumen to provide actionable insight for organizations, and have a specialty focus on healthcare analytics. Contact us to learn more.