Find value in your data analytics with customizable dashboards from BigQuery and Looker on Google Cloud
Aug. 31, 2022| By Sanchit Mishra, Software Engineer
Data drives today’s world. Every action that we take generates either log or transactional data—everything from a store purchase to the number of times we visit a website. Currently, businesses don’t use the staggering volume of raw data around us. If used efficiently, raw data can provide insights into business processes, opportunities for modernization and more. Understanding and utilizing data can accelerate business and innovation.
When combined, tools such as BigQuery and Looker provide key insights into identifying areas of opportunities and processing bottlenecks by analyzing terabytes of data and building customizable dashboards for end users. In this example, we create a data pipeline that generates Looker dashboards based on data stored in BigQuery, the fully managed data warehouse Google Cloud Platform (GCP) offers, that has built-in features like machine learning (ML), geospatial analysis and business intelligence (BI).
As a Google Cloud Premier Partner, we have expertise on BigQuery and how to make it work for your data strategy.
What Is BigQuery?
BigQuery provides data analytics that help users understand their data, gain business insights and aid in decision-making without infrastructural management. Its scalability and flexibility enable users to query terabytes of data within seconds and acquire data storage. BigQuery is widely used to analyze data, which is why it has become an important tool for data analysts, business analysts and ML engineers. Analytics features available in BigQuery include ad hoc analysis, geospatial analysis, ML and BI.
What Is Looker?
Looker is a software tool and platform that provides BI services, stores data applications and embeds analytics. It helps users share, explore and visualize data. In Looker, LookML produces data models and is written in a user-friendly language used by data experts. LookML tells Looker how to process and query data, which helps in creating dashboards and reports, and helps people recognize useful patterns in the data. Looker works with transactional databases such as MySQL and Oracle as well as different analytical data warehouses like BigQuery, Snowflake, Redshift and more.
Optimize BI Analytics: Why and When to Connect Looker with BigQuery?
BigQuery provides BI using a BI engine that grants fast, low inactivity in analytical services. Looker is not a prerequisite for BigQuery but, for specific applications such as BI, data applications, embedded analytics, or interactive analysis, Looker can give users easy-to-understand dashboards and reports. When an ML time series model predicts revenue based on historical input data, the data is preprocessed and used as input for the ML model. An end-to-end pipeline is implemented using the input data to feed the model and generate predictions, generate final visuals in the form of dashboards and gain insights into the model performance. Looker can help to expedite this process by generating dashboards and delivering useful observations from the output. This could also help people in making business decisions and identifying possible areas of concern.
How to Connect BigQuery with Looker
There are four stages in connecting BigQuery with Looker:
- Create service account with access to the project.
- Create persistent derived table (PDT) in Looker.
- Connect Looker with database.
- Test the connection. Create new project in Looker and generate visuals and dashboard.
STAGE 1: Set up a service account and obtain JSON credentials. With administrator permissions, create a service account using the following steps.
- Open “APIs and services” in Google Cloud platform and open the “Credentials” page to select the project (if required).

- Click on “CREATE CREDENTIALS” and select the “Service account” option.

- Enter the name and description for the service account, and then click “DONE.”
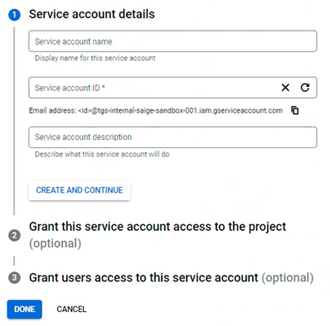
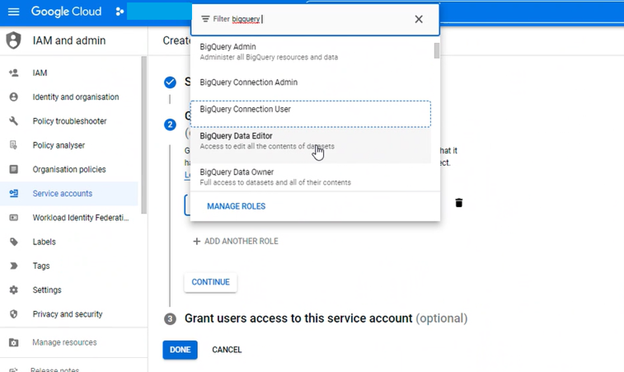
- Now the service account requires two predefined custom roles with conditions:
ROLE CONDITION BigQuery BigQuery Data Editor BigQuery BigQuery Job User Select the role and respective condition in the window then click on “Add Another Role” to add another role, and then click on “CONTINUE.”
- To give any user access to this service, add the user credentials in step 3. After that, click on “DONE.” The service account is created.
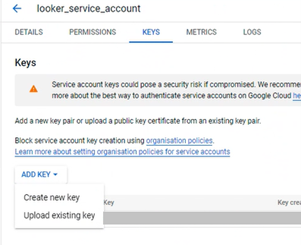
- Next, search for service accounts in the search bar of console and select it. A list of service accounts will appear. Search for the service account you just created. Select that account and choose the “Keys” tab.
- Click on the “ADD KEY” option. Select “Create new key.”
- Select the “JSON” option and click on the “CREATE” option.
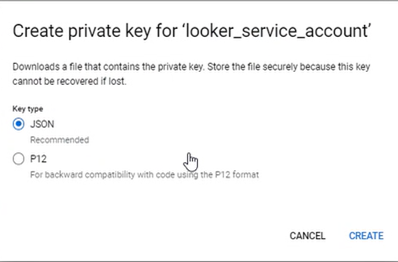
- The JSON key will be saved to your computer. Tip: Remember the location of the key in your system for future reference. Click on “CLOSE” and select “DONE.”

- Note the email address corresponding to the service account because it will be required during configuration of the Looker connection to BigQuery.

STAGE 2: Create a data set for PDT in Looker. (Please note that PDT is not supported by OAuth in the BigQuery connections.)
- Go to the BigQuery console and select your project; then select “Create dataset.”
- Provide ID, default location, default expiration date and type of encryption key management solution. Then select “Create dataset” option.
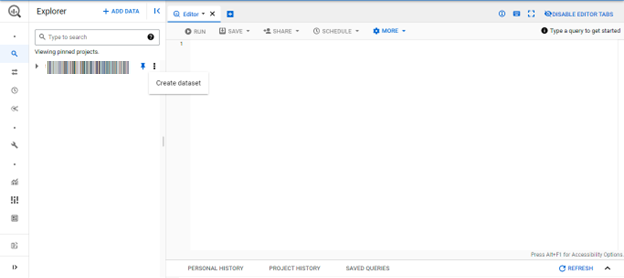
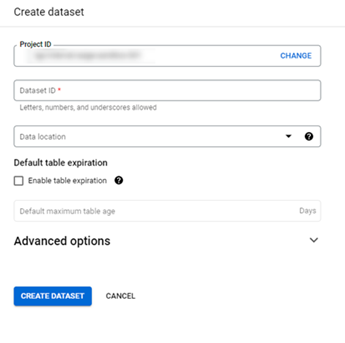
- Fill in the data set ID location and expiration date (if applicable) and click “CREATE DATASET.”
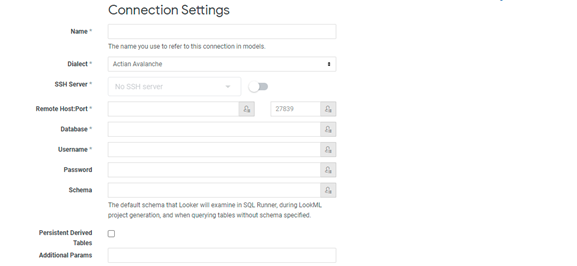
STAGE 3: Set up BigQuery connection in Looker. For this, you need go to the admin section of Looker. Click “Connections” and then “New Connections.” This will open a page with many configuration fields. Please see descriptions of the fields below.
- Dialect: There are two options in this: Fields Google BigQuery Standard SQL and Google BigQuery Legacy SQL.
- Project ID: The Google platform project ID mapped to service account.
- Data Set: The name of the data set to be used should be the same as the name of a data set in the BigQuery database.
- Use OAuth: Select this if you want to allow a Looker user to run queries on the database of the user’s BigQuery account.
- Service Account Email: The email ID generated after creation of service account in previous steps. Not applicable for connections using OAuth.
- Service Account JSON / P12 File: This is the certification file that was created in the previous step. Not applicable for connections using OAuth.
- Password: Enter the password if you are using a legacy .p12 credentials file. Leave this field empty if you are using a JSON credentials file. Not applicable for OAuth user connection.
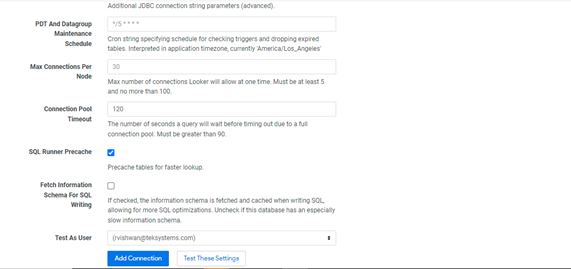
- Additional Params: These are the Java Database Connectivity (JDBC) parameters:
- connectTimeout: Time to wait for connection in milliseconds (default is 240,000).
- readTimeout: Time to wait for a read in milliseconds (default is 240,000).
- rootUrl: For BigQuery instance in a private network, specify an alternate endpoint to connect to BigQuery other than the default public endpoint.
- Temp Dataset: Refers to the BigQuery data set created for PDT in the previous steps. This is not applicable for OAuth type connection.
- Max Billing Gigabytes: If you don’t want any limit, leave it blank. For pricing details, refer here.
- Max Connections: Maximum number of connections Looker can have with a database. It is the number of simultaneous queries that Looker can run against the database.
- Connection Pool Timeout: Can leave this as the default value. For more information, refer here.
- SQL Runner Precache: If you want to preload table information as soon as you select the connection and schema, you can select this option.
- Disable Context Comment: This is the option to disable comments—if not selected, BigQuery will not be able to cache the result that can eventually affect its performance.
- Database Time Zone: Default is UTC. Users must ensure that BigQuery and Looker are in the same time zone.
For more information, please refer to the Looker documentation for connection parameters.
STAGE 4: Test the connection
- In the “Connection Setting” section, select “Test These Settings.”
- Select the Test option by the connection on the Connections admin page.

- Use the connection to create a project after successfully testing it.
Differences between Service Account and OAuth
Service Account with OAuth Service Account Use of PDTs ☒ ☑ Access data on behalf of end user ☑ ☒ Access own data of user inside Google Cloud environments ☒ ☑ Access own data on behalf of a user outside Google Cloud environments ☒ ☑ Requirement of user consent ☑ ☒ Long term usage
☒ ☑
To look more into OAuth and BigQuery connections, click here.
Building the Looker Dashboards
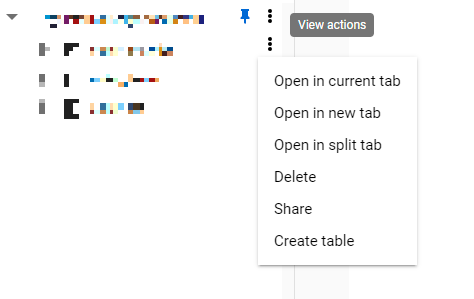
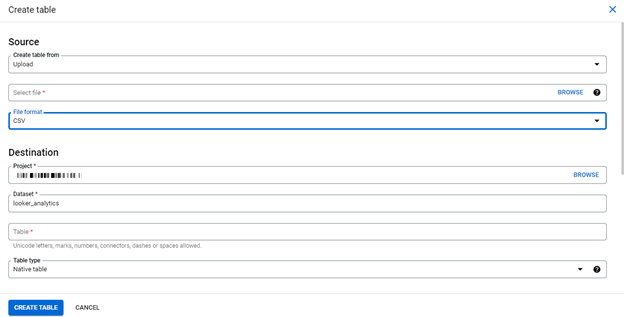
Before creating the Looker project, upload the source data into BigQuery. To upload the data files in a BigQuery data set, follow the below steps after navigating into BigQuery:
- Click on the "Create table" option in your data set.
- Select the file source, format and provide the destination table details and configuration before clicking on "Create Table."
Create the Looker Project and Generate Visuals and Dashboard
- To create a project, go to Develop > Projects. Select the “New Projects” option and fill in details of the project, such as the project name, starting point, connections, build views from schemas and ignore prefixes. In the connections, select the connection that was recently created.
- To create views from the database, select the option under “Starting Point,” and then select “Build Views from All Tables” if you want to use all the tables from views. If you want to use a single table to create a view, then mention the table name.
- Mention the Schema name that you want to use in Looker. Click on “Create Project” after filling in all details.
Once the project is created, the connection can now be used to create visualizations.
- Check in the “Develop” option and select the created project name. The model and views are automatically created with basic dimensions and measures created from the tables in the schema.
- To add new dimensions and measures, enter the LookML codes under their respective view name for new dimensions and measures. Once these measures and dimensions are created, explore the view by navigating to “Explore” and selecting the view name.
- Select the dimension then measure, and select “Run” to get the data and generate the visualization.
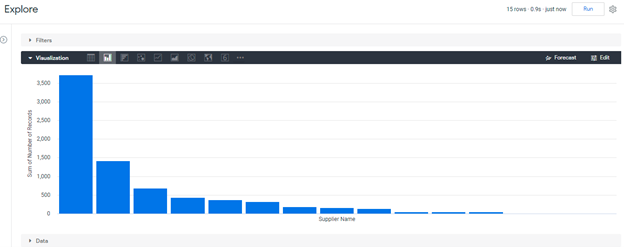
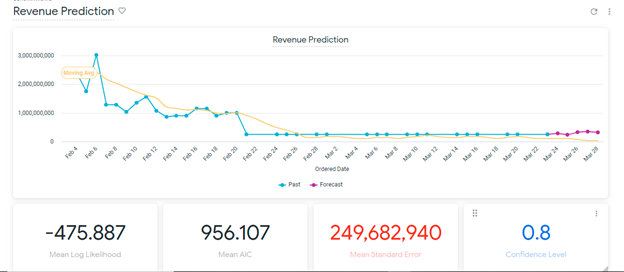
Other visuals can be created and added to the dashboard as shown below:
Now You’re Ready to Leverage Data to Fuel Business Decisions
With Looker, you can generate summary reports and dashboard visuals from the ML model that aid in understanding and leveraging the terabytes of data stored in BigQuery for business process enhancements as well as identifying any areas that may need improvement.
Sources
- Google BigQuery
- Authentication Overview
- OAuth API verification FAQs:
- Authentication pages
- What is BigQuery?
- Using Looker
The information provided in this article is for educational and informative purposes only and is intended to inform readers and should not be understood as a guarantee or assurance of future success in any matter. Every system is different, and no specific outcome is guaranteed using the platforms mentioned here, such as BigQuery and/or Looker.
About the Author

Sanchit is a TEKsystems Global Services software engineer who is GCP ACE certified. He has worked on dashboard projects relating to data migration from Tableau or Qlik to Looker and has expertise in blockchain, CCAI, data transformation and web scraping projects. He is skilled in BigQuery, Looker, Cloud Functions, App Engine, SQL, Tableau, Python and also on machine-learning algorithms.
Related Articles

Our Approach
As a Google Cloud Premier Partner, we support the full spectrum of delivering Google Cloud Platform (GCP) initiatives. From design to implementation—we’re there every step of the way to help you navigate today’s complex, multicloud environment, maximize your investments and build for the future.